En:Filling planner: Unterschied zwischen den Versionen
Sonora (Diskussion | Beiträge) (Die Seite wurde neu angelegt: „<embedvideo service="youtube" dimensions="350" alignment="right" >https://youtu.be/ZrzVZJTm9UI</embedvideo> The filling planner is an aid for planning fillings in the coming months. It calculates future stocks based on the historical sales stock. To get to the filling planner, go to Articles - Stocks - Filling planner. To be able to use the planner sensibly, you should work with Winestro.Cloud for at least 1 year so that the data basis is meaningful. E…“) |
Sonora (Diskussion | Beiträge) |
||
| Zeile 7: | Zeile 7: | ||
== Structure == | == Structure == | ||
[[Datei: | [[Datei:Filling mask.png|500px|right|miniatur|structure of the mask]] | ||
The table shows the following information: | The table shows the following information: | ||
# Wine number (hover over to see the name - click for on the map) | # Wine number (hover over to see the name - click for on the map) | ||
Aktuelle Version vom 14. Oktober 2024, 11:44 Uhr
The filling planner is an aid for planning fillings in the coming months. It calculates future stocks based on the historical sales stock. To get to the filling planner, go to Articles - Stocks - Filling planner.
To be able to use the planner sensibly, you should work with Winestro.Cloud for at least 1 year so that the data basis is meaningful. Especially with large amounts of data, working in the filling planner can be slow, as many calculations
are performed simultaneously.
Structure
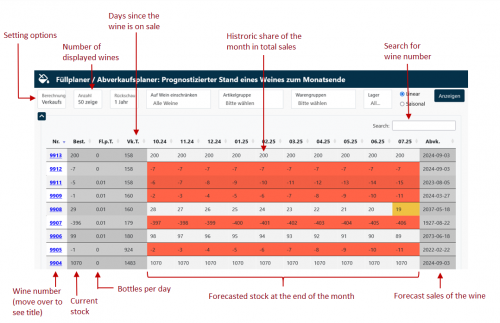
The table shows the following information:
- Wine number (hover over to see the name - click for on the map)
- The current stock of the article
- The calculated sales quantity per average day
- The period that the wine has already been on sale (from the first movement in stock)
- The forecast for the coming months
- The planned sales
The list is sortable and searchable.
Note: A maximum of 150 wines are displayed so that the page remains performant. You can choose between further numbers of wines. The smallest possible number of wines is 10 wines.
Stock warning
The stock warning (fields highlighted in yellow) is 50, unless something has been set individually for the item in the en:Article card.
Calculation base
Here you can specify which data should be used for the calculation. The forecast always shows only active wines in the active sales stock. However, if you use more complex forecast options (see below), previous wines and fillings are also used from the out-of-stock wines in order to obtain a broader calculation basis.
Sales history of the wine
The forecast data is based only on the individual wine and the days since it was sold.
Sales history of the wine and of 5 previous wines
All previous wines are also taken into account here. This greatly extends the period under consideration over the last few years. The wine number (+x) shows you how many previous wines are taken into account for this wine.
Sales history of all fillings (+) for this wine
In this setting, all fillings are added together. Everything after a + is cut off and all wines with the part before the + are counted as belonging together. This allows you to view fillings together.
Example: Wines 1+1 and 1+2 would be considered as belonging together and predicted.
Sales history of all fillings (+) of this wine including all predecessors (max. 5)
Here the methods of the previous wines and the fillings are combined if they differ for you.
Note: A maximum of 5 wines or fillings are always combined.
Restrictions to wines / article groups / product groups and stock
Here you can search for a specific wine / product group / stock and restrict the view to this article.
Linear and seasonal
There are two ways to calculate sales:
Linear
The days since the wine has been sold are calculated here. Then it is calculated how much wine has already been sold. If you divide the number of wines sold by the days, you get a value per day. Now you can determine the number of days that a wine will still be on sale if you know the current stock and divide it by the number of wines sold per day.
This setting can be particularly useful if you have not been working with Winestro.Cloud for long and the data basis is therefore still too small to map seasonal fluctuations.
Seasonal
Here too, the value / day is first determined linearly. Then we look at how much a winery sells in a year and how much of this falls on the respective months (see in the first line). The linear value (see above) can then be corrected upwards or downwards to give you a better picture.
Note: The seasonal view only shows fluctuations of the winery in general, but not for the individual article (planned for an upcoming update).
All settings can be combined with each other and provide different views of the movements.
